How to Sniff USB Traffic/Reverse Engineer USB Device Interactions Using Wireshark
I was trying to reverse engineer the protocol used to communicate with a 3D printer and was thinking about hooking up an oscilloscope when I discovered that USB traffic can be captured and analyzed by Wireshark (which I had thought was only for network traffic). These instructions are for sniffing USB data using Wireshark on Mac OS, but the process should be similar under Linux and Windows.
NB: As of MacOS 10.15.1 Catalina it is no longer possible to activate the virtual USB interface XHC20 using the method described below, although it appears it might be possible if you first disable System Integrity Protection as described here: https://forums.developer.apple.com/thread/124875
Enable USB Port Monitoring
Mac OS has a virtual port that can be used to examine USB traffic. Find the port(s), open a terminal window and type:
tcpdump -Dand look for a port name starting with XHC like XHC0, XHC1 in the output. On my machine the interface was XHC20.
To enable the port(s), type the following in the terminal window using the port name(s) you found:
sudo ifconfig XHC20 upNB: When you are done with your research, disable the port by typing the following in a terminal window:
sudo ifconfig XHC20 downIdentify the Target Device
Click the Apple menu in the top left corner of the screen and select “About This Mac”:
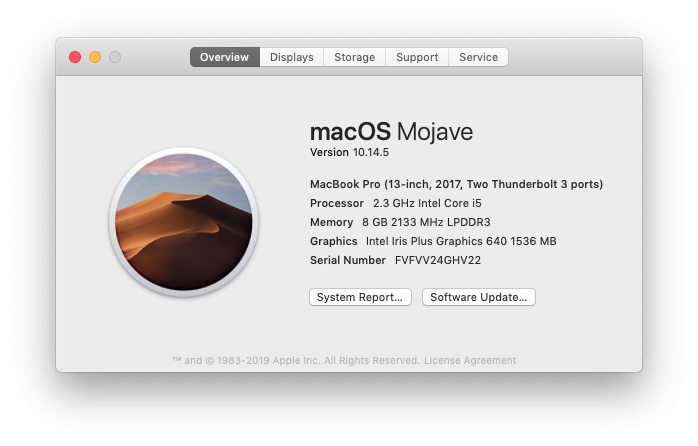
Click “System Report”, select “USB” on the left hand side and then search for the USB device you are interested in:
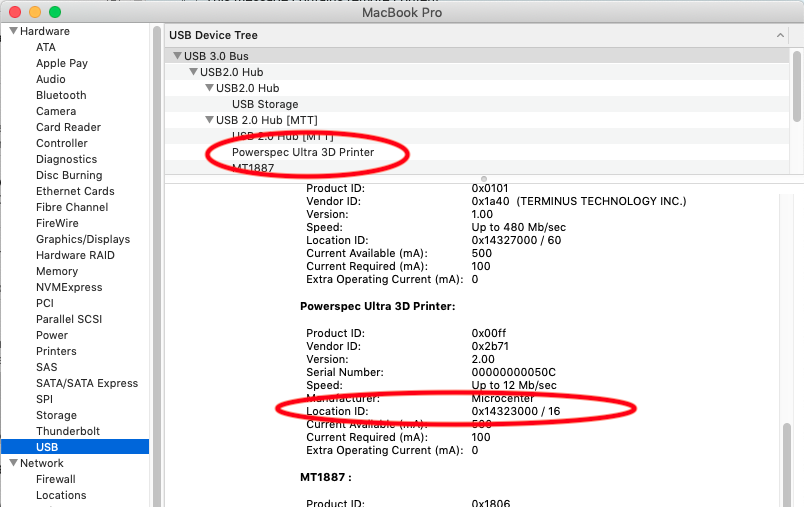
Note down the “Location ID” of the device – you will need that to find the traffic in Wireshark.
Wireshark
After installing Wireshark, fire it up and select the port to capture – XHC20 (or whatever port you found). You should immediately see USB packets being displayed in the capture window.
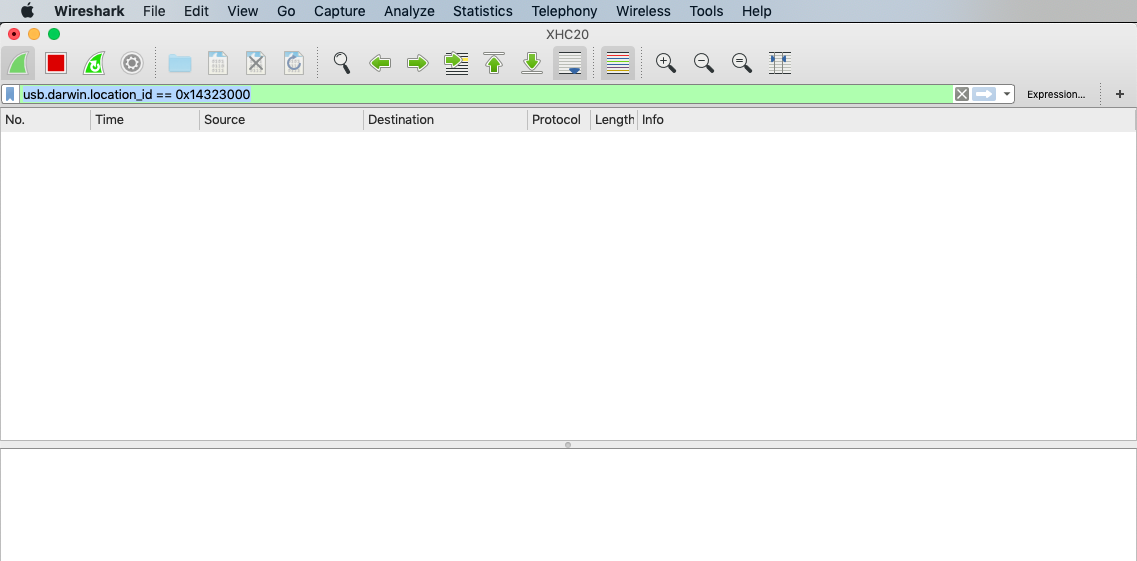
In the space for a display filter above the capture window, enter the following (replacing the ID with the location ID for your device):
usb.darwin.location_id == 0x14323000You should now only see packets related to your device – if no packets are being sent to the USB device then the display window may be empty.
After you capture some packets the display will look more like:
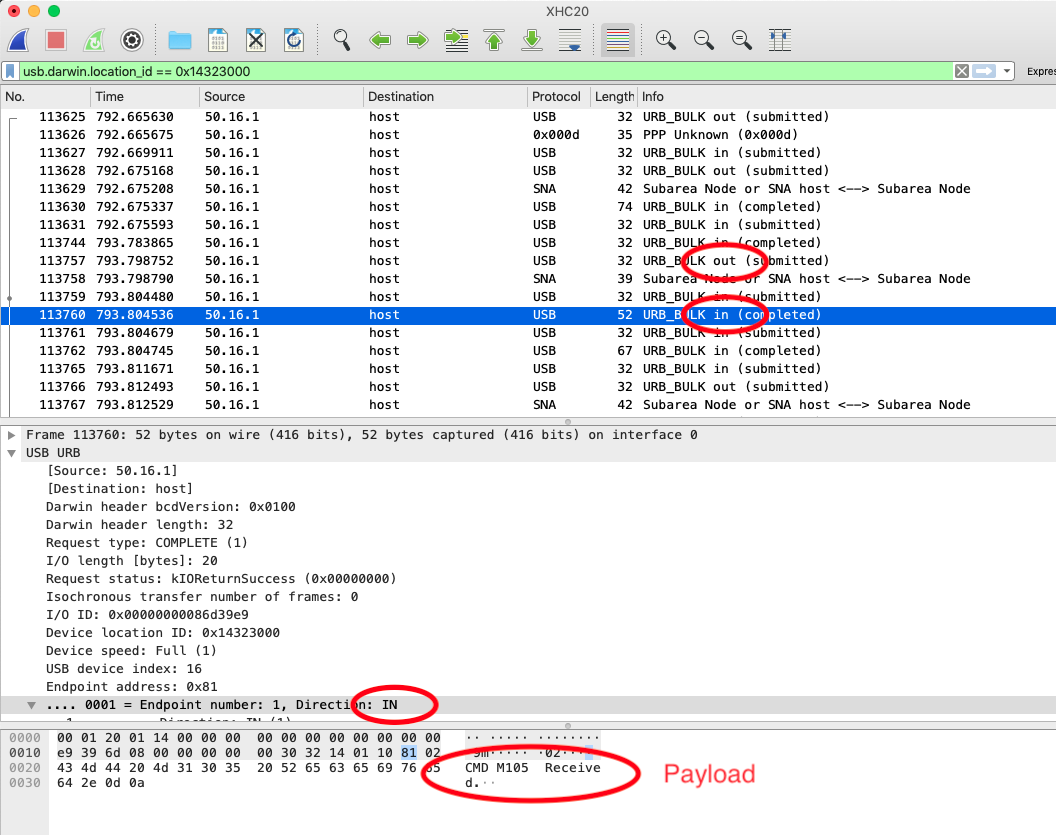
In the above picture Wireshark is configured to display the packet list in the top pane, packet details in the middle pane and the raw packet in the bottom pane. The direction of the packets is displayed “in” (into the computer from client), “out” (from computer into the client device). The USB payload seems to start at byte 0x0020 in the raw packet data. In the above picture the packet is displaying the response by a 3D printer to a command issued by the computer, using a variation of the G-Code protocol.
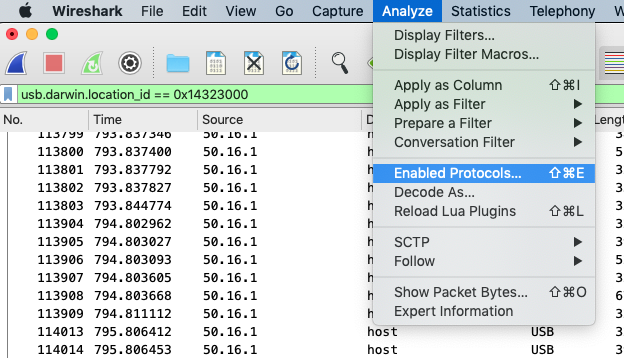
Note that Wireshark has mis-identified some of the packets as “SNA” – you can tell Wireshark what protocols to expect (by default all are enabled), thereby forcing it to display all packets as USB:
Wireshark Tips
Beware – sometimes it translates the hex to text incorrectly:
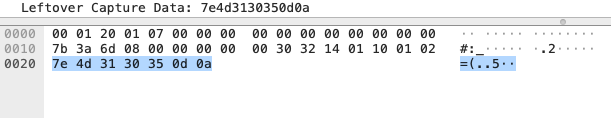
This should translate to ~M105 . If you are expecting ASCII text, you can use a site like http://www.unit-conversion.info/texttools/hexadecimal/ to verify the translation.
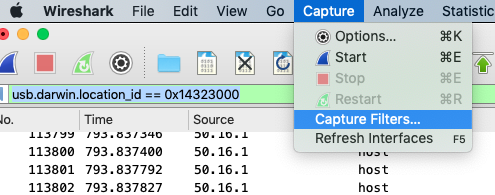
While Wireshark is running it can be collecting huge volumes of data which can fill up your memory/drive, so remember to stop the capture when you are done. You can limit the amount of captured data (especially useful if you are planning to save the capture as a file for later analysis) by creating a capture filter instead of/or in addition to the display filter. If you intend to use the filter more than once then define it under the “Capture” menu:
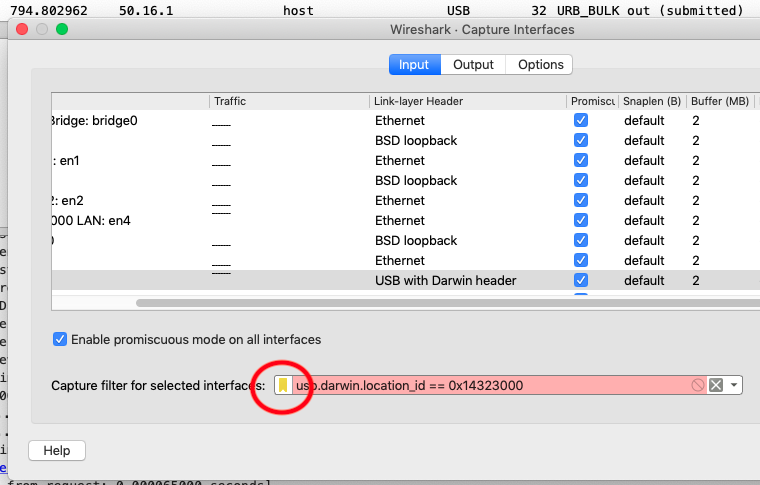
You select filters to use during data capture by clicking “Options” under the “Capture” menu to get the capture options window:
Click the circled icon to use a predefined filter (eg one you just created), or type a filter in the box. Unfortunately, as of writing this, USB capture filtering is not implemented.
This is fascinating – and I’m way out of my depths. I wanted to trigger a function on my Wacom Cintiq via Apple Script but it turns out the API has been deprecated. My next thought was maybe I can figure out the information that is transmitted via USB when I push the button on my device. Your post has got me that far. Not sure what comes next with regards to using this information to trick the computer into thinking I pushed the physical button. Might be as far as this goes for me.
Are you aiming to trigger something on the Wacom or trigger an AppleScript when doing something on the Wacom? Which Cintiq is it? There is some API support here and it looks like some people have been able to use Python to talk to Wacom devices.
This is great! I have been wanting to use an old deprecated sports camera (liquid image) as a webcam and will try to see if the camera is sending video data through the USB